
Page 103 - 《中国药房》2021年22期
P. 103
网 状 Meta 分 析 结 果 显 示 ,试 验 组 使 用 高 剂 量
Random sequence generation(selection bias)
Allocation concealment(selection bias) NAC[MD=-0.45,95%CI(-0.74,-0.17),P<0.05]、
Blinding of participants and personnel(penormance bias)
Blinding of outcome assessment(detection bias) 羧甲司坦[MD=-0.59,95%CI(-0.86,-0.32),P<
Incomplete outcome data(attrition bias)
0.05]、厄多司坦[MD=-0.26,95%CI(-0.51,-0.01),
Selective reporting(reporting bias)
Other bias P<0.05]患者的年急性加重率均显著低于对照组,试验组
0% 25% 50% 75% 100% 使用高剂量NAC[MD=-0.55,95%CI(-0.98,-0.11),
Low risk of bias Unclear risk of bias High risk of bias
P<0.05]、羧甲司坦[MD=-0.69,95%CI(-1.11,-0.26),
图2 偏倚风险条形图 P<0.05]患者的年急性加重率均显著低于低剂量NAC,
Fig 2 Bar chart of bias risk 其余各组组间比较差异均无统计学意义(P>0.05)。结
果见表2。
表2 两组患者年急性加重率的网状Meta分析结果
Tab 2 Results of network Meta-analysis of annual
Moretti 2004
Decramer 2005
Tatsumi 2007
Pela 1999
Papi 2019
Tse 2014
Yasuda 2006
Zheng 2008
Zheng 2014
Dalnegro 2017
Calverley 2019
Schermer 2009
Random sequence generation(selection bias)
Allocation concealment(selection bias)
acute exacerbation rate in 2 groups
Blinding of participants and personnel(penormance bias)
Blinding of outcome assessment(detection bias) 组别 MD(95%CI)
Incomplete outcome data(attrition bias) 试验组 厄多司坦
Selective reporting(reporting bias) 0.33(-0.04,0.69) 羧甲司坦
Other bias
0.19(-0.18,0.56) -0.14(-0.52,0.24) 高剂量NAC
*
图3 偏倚风险总图 -0.36(-0.77,0.05) -0.69(-1.11,-0.26) -0.55(-0.98,-0.11) * 低剂量NAC
对照组 -0.26(-0.51,-0.01) -0.59(-0.86,-0.32) -0.45(-0.74,-0.17) 0.10(-0.23,0.42)安慰剂
*
*
*
Fig 3 Total chart of bias risk
注:P<0.05
*
低剂量NAC Note: P<0.05
*
高剂量NAC
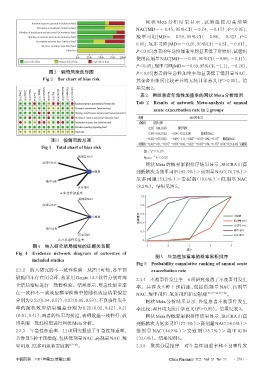
网状 Meta 的概率累积排序结果显示,SUCRA 由高
安慰剂 到低依次为羧甲司坦(93.3%)>高剂量NAC(76.7%)>
厄多司坦(53.2%)>安慰剂(18.6%)>低剂量 NAC
羧甲司坦
厄多司坦 (8.2%)。结果见图5。
A.年急性加重率
1.0
低剂量NAC
高剂量NAC 0.8
概率累积 低剂量NAC
安慰剂 0.6 安慰剂
0.4
高剂量NAC
羧甲司坦
0.2 羧甲司坦
厄多司坦 厄多司坦
B.不良事件发生率 0
图4 纳入研究结局指标的证据关系图 1 2 3 4 5
排序
Fig 4 Evidence network diagram of outcomes of
图5 年急性加重率的概率累积排序
included studies
Fig 5 Probability cumulative ranking of annual acute
2.3.2 纳入研究的不一致性检验 从图 4 可知,各干预 exacerbation rate
措施间不存在闭合环,故采用Gemtc 14.3软件分别对两 2.3.4 不良事件发生率 6项研究报道了不良事件发生
个结局指标进行一致性检验。结果显示,年急性加重率 率。共涉及 5 种干预措施,包括低剂量 NAC、高剂量
在一致和不一致效应模型检验中的随机效应结果偏差 NAC、羧甲司坦、厄多司坦和安慰剂 [16,19-20,23-25] 。
分别为0.22(0.04,0.57)、0.23(0.05,0.58),不良事件发生 网状 Meta 分析结果显示,各组患者不良事件发生
率的随机效应结果偏差分别为 0.21(0.02,0.42)、0.21 率比较,差异均无统计学意义(P>0.05)。结果见表3。
(0.01,0.41),两者的结果均接近,表明数据一致性好,故 网状 Meta 的概率累积排序结果显示,SUCRA 由高
均采用一致性模型进行网状Meta分析。 到低依次为厄多司坦(77.4%)>高剂量NAC(58.6%)>
2.3.3 年急性加重率 11项研究报道了年急性加重率, 低剂量 NAC(44.8%)>安慰剂(35.7%)>羧甲司坦
共涉及5种干预措施,包括低剂量NAC、高剂量NAC、羧 (33.6%)。结果见图6。
甲司坦、厄多司坦和安慰剂 [17-27] 。 2.3.5 聚类分层排序 对年急性加重率和不良事件发
中国药房 2021年第32卷第22期 China Pharmacy 2021 Vol. 32 No. 22 ·2781 ·