
Page 99 - 202012
P. 99
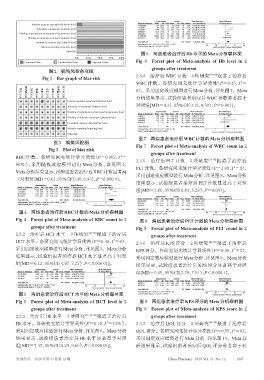
Random sequence generation(selection bias)
                 Allocation concealment(selection bias)
         Blinding of participants and personnel(penormance bias)
             Blinding of outcome assessment(detection bias)
                 Incomplete outcome data(attrition bias)
                   Selective reporting(reporting bias)
                             Other bias
                                                              图6 两组患者治疗后Hb水平的Meta分析森林图
                                 0%   25%  50%  75%  100%
            Low risk of bias  Unclear risk of bias  High risk of bias  Fig 6 Forest plot of Meta-analysis of Hb level in 2
                                                                  groups after treatment
                      图2 偏倚风险条形图
                                                           2.3.4  治疗后 WBC 计数       4 项研究   [22-25] 报道了治疗后
                   Fig 2 Bar graph of bias risk
                                                                                                         2
                                                           WBC 计数。各研究间无统计学异质性(P=0.45,I =
                                                           0)。采用固定效应模型进行Meta分析,详见图7。Meta
                                                           分析结果显示,试验组患者治疗后 WBC 计数显著高于
              胡丽2015
                     江红2018
                程辉2008
                   王岩2008
            陈宇鹏2008
                          张宪真2009
                            冯义怜2008
                       朱彤2017
          陈红2014
                              Random sequence generation(selection bias)
                                                           对照组[MD=0.31,95%CI(0.12,0.50),P=0.001]。
                              Allocation concealment(selection bias)
                              Blinding of participants and personnel(penormance bias)
                              Blinding of outcome assessment(detection bias)
                              Incomplete outcome data(attrition bias)
                              Selective reporting(reporting bias)
                              Other bias
                                                            图7 两组患者治疗后WBC计数的Meta分析森林图
                        图3 偏倚风险图
                                                           Fig 7  Forest plot of Meta-analysis of WBC count in 2
                      Fig 3 Plot of bias risk
                                                                  groups after treatment
                                                     2
        RBC 计数。各研究间有统计学异质性(P=0.002,I =
                                                           2.3.5  治疗后 PLT 计数       3 项研究   [24-26] 报道了治疗后
        80%),采用随机效应模型进行 Meta 分析,详见图 4。
                                                           PLT计数。各研究间无统计学异质性(P=1.00,I =0),
                                                                                                     2
        Meta分析结果显示,试验组患者治疗后RBC计数显著高
                                                           采用固定效应模型进行Meta分析,详见图8。Meta分析
        于对照组[MD=0.62,95%CI(0.30,0.93),P=0.000 1]。
                                                           结果显示,试验组患者治疗后 PLT 计数显著高于对照
                                                           组[MD=3.06,95%CI(0.84,5.28),P=0.007]。
         图4 两组患者治疗后RBC计数的Meta分析森林图
        Fig 4 Forest plot of Meta-analysis of RBC count in 2  图8 两组患者治疗后PLT计数的Meta分析森林图
              groups after treatment                       Fig 8 Forest plot of Meta-analysis of PLT count in 2
        2.3.2  治疗后 HCT 水平      3 项研究   [27-29] 报道了治疗后             groups after treatment
                                                  2
        HCT水平。各研究间无统计学异质性(P=0.48,I =0),                    2.3.6  治疗后 KPS 评分       2 项研究   [22,28] 报道了治疗后
        采用固定效应模型进行Meta分析,详见图5。Meta分析                       KPS评分。各研究间无统计学异质性(P=0.95,I =0),
                                                                                                     2
        结果显示,试验组患者治疗后 HCT 水平显著高于对照                         采用固定效应模型进行Meta分析,详见图9。Meta分析
        组[MD=6.12,95%CI(4.97,7.27),P<0.000 01]。            结果显示,试验组患者治疗后 KPS 评分显著高于对照
                                                           组[MD=5.15,95%CI(2.79,7.51),P<0.000 1]。


         图5 两组患者治疗后HCT水平的Meta分析森林图
        Fig 5 Forest plot of Meta-analysis of HCT level in 2  图9 两组患者治疗后KPS评分的Meta分析森林图
              groups after treatment                       Fig 9 Forest plot of Meta-analysis of KPS score in 2
        2.3.3  治疗后 Hb 水平      7 项研究   [23-28,30] 报道了治疗后           groups after treatment
        Hb水平。各研究无统计学异质性(P=0.10,I =43%),                    2.3.7  治疗后 QOL 评分       2 项研究   [24-25] 报道了治疗后
                                               2
                                                                                                      2
        采用固定效应模型进行Meta分析,详见图6。Meta分析                       QOL评分。各研究间无统计学异质性(P=0.55,I =0),
        结果显示,试验组患者治疗后 Hb 水平显著高于对照                          采用固定效应模型进行 Meta 分析,详见图 10。Meta 分
        组[MD=7.47,95%CI(5.29,9.66),P<0.000 01]。            析结果显示,试验组患者治疗后 QOL 评分显著高于对


        中国药房    2020年第31卷第12期                                            China Pharmacy 2020 Vol. 31 No. 12  ·1497  ·