
Page 23 - 202007
P. 23
1.8 1.4
1.0
1.2
细胞数,10 3 × 0.6 细胞数,10 3 × 0.5
0 0
1.7 5 10 16.8 1.7 5 10 16.8
A.对照组 B.马钱苷低浓度组 PI-A(×10) PI-A(×10)
6
6
A.对照组 B.马钱苷低浓度组
1.4 1.4
1.0 1.0
细胞数,10 3 × 0.5 细胞数,10 3 × 0.5
0 0
C.马钱苷中浓度组 D.马钱苷高浓度组 1.7 5 10 16.8 1.7 5 10 16.8
PI-A(×10) PI-A(×10)
6
6
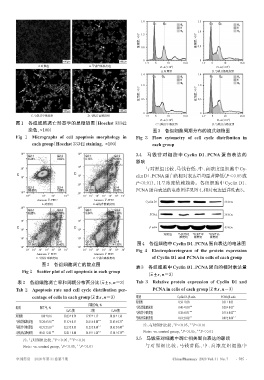
图 1 各组细胞凋亡形态学的显微镜图(Hoechst 33342 C.马钱苷中浓度组 D.马钱苷高浓度组
染色,×100) 图3 各组细胞周期分布的流式细胞图
Fig 1 Micrographs of cell apoptosis morphology in Fig 3 Flow cytometry of cell cycle distribution in
each group(Hoechst 33342 staining,×100) each group
10 5.5 10 5.5 3.4 马钱苷对细胞中 Cyclin D1、PCNA 蛋白表达的
影响
10 4
10 4 与对照组比较,马钱苷低、中、高浓度组细胞中 Cy-
PI PI 10 3 clin D1、PCNA蛋白的相对表达量均显著降低(P<0.05或
10 3
P<0.01),且呈浓度依赖趋势。各组细胞中 Cyclin D1、
10 2
PCNA蛋白表达的电泳图详见图4,相对表达量详见表3。
10 1.4 10 1
10 3.3 10 5 10 6 10 7.3 10 1 10 2 10 3 10 4 10 5 10 6 10 7
Annexin Ⅴ-FITC Annexin Ⅴ-FITC
Cyclin D1 36 kDa
A.对照组 B.马钱苷低浓度组
10 5.5 10 5.5
PCNA 36 kDa
10 4 10 4
PI PI β-actin 43 kDa
10 3 10 3
对照组 马钱苷低 马钱苷中 马钱苷高
10 2 10 2 浓度组 浓度组 浓度组
图4 各组细胞中Cyclin D1、PCNA蛋白表达的电泳图
10 1 10 1
10 1 10 2 10 3 10 4 10 5 10 6 10 7 10 1 10 2 10 3 10 4 10 5 10 6 10 7 Fig 4 Electrophoretogram of the protein expression
Annexin Ⅴ-FITC Annexin Ⅴ-FITC
C.马钱苷中浓度组 D.马钱苷高浓度组 of Cyclin D1 and PCNA in cells of each group
图2 各组细胞凋亡的散点图
表3 各组细胞中Cyclin D1、PCNA蛋白的相对表达量
Fig 2 Scatter plot of cell apoptosis in each group
(x±±s,n=3)
表2 各组细胞凋亡率和周期分布百分比(x±±s,n=3) Tab 3 Relative protein expression of Cyclin D1 and
Tab 2 Apoptosis rate and cell cycle distribution per- PCNA in cells of each group(x±±s,n=3)
centage of cells in each group(x±±s,n=3) 组别 Cyclin D1/β-actin PCNA/β-actin
对照组 0.58±0.03 0.31±0.03
周期分布,%
组别 凋亡率,% 马钱苷低浓度组 0.40±0.03 ** 0.20±0.03 *
G0/G1期 S期 G2/M期
马钱苷中浓度组 0.38±0.31 ** 0.15±0.02 **
对照组 1.08±0.16 30.23±0.79 17.97±1.17 30.26±1.36 ** **
马钱苷高浓度组 0.18±0.02 0.09±0.04
马钱苷低浓度组 35.24±3.55 ** 31.57±0.51 26.55±0.80 ** 25.67±0.31 *
*
注:与对照组比较,P<0.05, P<0.01
**
马钱苷中浓度组 41.71±3.10 ** 32.13±0.35 31.23±0.60 ** 18.61±0.40 **
**
*
马钱苷高浓度组 49.43±2.81 ** 32.21±0.48 34.59±1.24 ** 17.54±0.79 ** Note:vs. control group,P<0.05, P<0.01
3.5 马钱苷对细胞中凋亡相关蛋白表达的影响
**
*
注:与对照组比较,P<0.05, P<0.01
*
**
Note:vs. control group,P<0.05, P<0.01 与对照组比较,马钱苷低、中、高浓度组细胞中
中国药房 2020年第31卷第7期 China Pharmacy 2020 Vol. 31 No. 7 ·785 ·