
Page 54 - 《中国药房》2023年22期
P. 54
response to oxidative stress hepatitis B
cellular response to chemical stress human cytomegalovirus infection
response to nutrient levels
cellular response to oxidative stress ferroptosis
富集基因数 lipid and atherosclerosis P
response to oxygen levels 9.32×10 -24
40
neuron death 50 HIF-1 signaling pathway 1.14×10 -15
60 Kaposi sarcoma-associated herpesvirus 2.29×10 -15
response to decreased oxygen levels 70 infection 3.43×10 -15
regulation of neuron death central carbon metabolism in cancer -15
P 4.57×10
regulation of apoptotic signaling pathway 4.06×10 -22 coronavirus disease:COVID-19
3.05×10 -22
response to hypoxia 2.03×10 -22 PI3K/Akt signaling pathway
response to metal ion 1.02×10 -22
6.43×10 -46 prostate cancer
cellular response to external stimulus
response to reactive oxygen species 0 20 40 60
cellular response to oxygen levels 富集基因数
cellular response to decreased oxygen levels 图2 VTM干预GBM的KEGG富集结果柱状图(富集
0.100 0.125 0.150 基因占比排名前10位)
富集基因占比
A. BP
[4]
参考相关文献 设置),并设置不加药物、不加细胞的空
focal adhesion
cell-substrate junction 白组,每组设 3 个复孔。培养 24 h 后,每孔加入 CCK-8
vesicle lumen 工作液10 μL,孵育1 h。使用酶标仪于450 nm波长处检
secretory granule lumen
富集基因数
cytoplasmic vesicle lumen 20 测各孔的光密度(OD)值并按下式计算细胞存活率:细
membrane raft 30
40 胞存活率=(OD 实验组-OD 空白组)/(OD 对照组-OD 空白组)×
membrane microdomain 50
organelle outer membrane 100%。采用 GraphPad Prism 8.3.0 软件对数据进行统计
P
outer membrane 8.0×10 -8
6.0×10 -8 分析,实验数据以 x±s 表示,多组间比较采用单因素方
cytosolic ribosome
4.0×10 -8
melanosome 2.0×10 -8 差分析,进一步两两比较采用LSD-t检验,检验水准α=
pigment granule
ficolin-1-rich granule lumen 0.05(统计方法下同)。结果(图3)显示,与对照组比较,
small ribosomal subunit VTM 各浓度组的细胞存活率均显著降低(P<0.01),且
cytosolic small ribosomal subunit
有一定的浓度依赖趋势。
0.04 0.06 0.08 0.10
富集基因占比 120
B. CC
100
DNA-binding transcription factor binding
RNA polymerase Ⅱ-specific DNA-binding
transcription factor binding 80
ubiquitin-like protein ligase binding a
ubiquitin protein ligase binding 细胞存活率/% 60
DNA-binding transcription activator activity, 富集基因数 a
RNA polymerase Ⅱ-specific 10 40 a a
DNA-binding transcription activator activity 20 a
30
cadherin binding 40 20 a
50
protein serine/threonine kinase activity
cytokine activity P 0
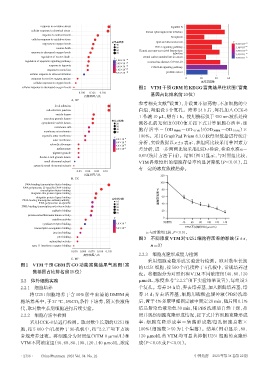
cytokine receptor binding 1.0×10 -6 对照组 40 60 80 100 120 140
transcription coregulator binding 5.0×10 -7 VTM不同浓度组/(μmol/L)
iron ion binding a:与对照组比较,P<0.01。
p53 binding 图3 不同浓度VTM对U251细胞存活率的影响(x±s,
antioxidant activity
type Ⅰ interferon receptor binding n=3)
0.025 0.050 0.075 0.100 0.125
富集基因占比 2.2.3 细胞克隆形成能力检测
C. MF 采用细胞克隆形成实验进行检测。取对数生长期
图1 VTM 干预 GBM 的 GO 功能富集结果气泡图(富
的 U251 细胞,按 500 个/孔接种于 6 孔板中,常规培养过
集基因占比排名前15位)
夜。将细胞分为对照组和VTM不同浓度组(40、80、120
2.2 体外细胞实验 μmol/L,浓度参考“2.2.2”项下实验结果设置),每组设 3
2.2.1 细胞培养 个复孔。培养24 h后,弃去培养基,加入新鲜培养基,培
将 U251 细胞培养于含 10% 胎牛血清的 DMEM 高 养 14 d;弃去培养基,细胞用磷酸盐缓冲液(PBS)洗涤
糖培养基中,于 37 ℃、5%CO2条件下培养,隔天换液传 后,置于4%多聚甲醛固定液中固定20 min,随后用0.1%
代,取对数生长期细胞进行后续实验。 结晶紫染色液染色 30 min,用 PBS 洗涤后自然干燥,拍
2.2.2 细胞存活率检测 照并观察细胞克隆形成情况,按下式计算细胞克隆形成
采用CCK-8法进行检测。取对数生长期的U251细 率:细胞克隆形成率=集落形成数/每孔细胞总数×
胞,按 5 000 个/孔接种于 96 孔板中,按“2.2.1”项下方法 100%(细胞数>50 为 1 个集落)。结果(图 4)显示,80、
常规培养过夜。将细胞分为对照组(VTM 0 μmol/L)和 120 μmol/L 的 VTM 均可显著抑制 U251 细胞的克隆形
VTM不同浓度组(40、60、80、100、120、140 μmol/L,浓度 成(P<0.05或P<0.01)。
· 2736 · China Pharmacy 2023 Vol. 34 No. 22 中国药房 2023年第34卷第22期