
Page 23 - 《中国药房》2021年13期
P. 23
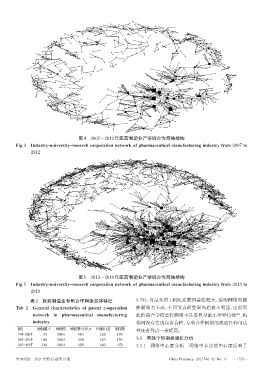
图4 2007-2012年医药制造业产学研合作网络结构
        Fig 4  Industry-university-research cooperation network of pharmaceutical manufacturing industry from 2007 to
              2012


                                   图5   2013-2019年医药制造业产学研合作网络结构
        Fig 5 Industry-university-research cooperation network of pharmaceutical manufacturing industry from 2013 to
              2019

              表2 医药制造业专利合作网络总体特征                           0.793,与最大值 1 相比系数值差距较大,说明网络的整
        Tab 2 General characteristics of patent cooperation  体凝聚力不高,不同节点间集聚的趋势不明显,也说明
               network in pharmaceutical manufacturing     此阶段产学研合作网络不具备典型的小世界特性 ,机
                                                                                                      [25]
               industry                                    构间没有实现自由合作,专利合作网络的流通性和可达
         阶段      网络规模,个  网络密度  网络度数中心势,%  平均路径长度  集聚系数     性还有待进一步提高。
         1998-2006年  335  0.006 0  0.421    2.622  0.730
         2007-2012年  1 064  0.002 4  0.300  6.875  0.793   3.3 网络个体指标演化分析
         2013-2019年  2 364  0.001 4  0.070  6.463  1.279   3.3.1  网络中心度分析         网络中节点的中心度反映了


        中国药房    2021年第32卷第13期                                             China Pharmacy 2021 Vol. 32 No. 13  ·1553 ·