
Page 27 - 《中国药房》2021年第1期
P. 27
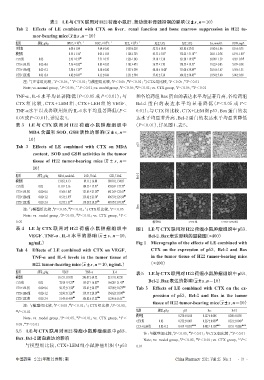
表2 LE与CTX联用对H22荷瘤小鼠肝、肾功能和骨髓抑制的影响(x±±s,n=10)
        Tab 2 Effects of LE combined with CTX on liver,renal function and bone marrow suppression in H22 tu-
               mor-bearing mice(x±±s,n=10)
                                   9
                                                           9
        组别       剂量,g/kg      WBC,×10 L -1  RBC,×10 L -1  PLT,×10 L -1  ALT,U/L  AST,U/L   Scr,mmol/L  BUN,mg/L
                                               12
        正常组                    6.00±1.84   9.64±0.60   1 050±218  52.71±10.41  103.85±27.01  19.85±1.06  8.16±0.75
        模型组                    8.55±1.56 *  8.05±1.05  1 128±303  43.33±5.87 *  172.22±51.10 **  20.11±0.78  6.19±1.00 *
        CTX组      0.02         2.93±0.57 ##  7.71±0.77  1 226±243  39.10±3.38  121.20±19.95 ##  20.90±1.59  4.92±0.74 #
        CTX+LEL组  0.02+0.6     7.36±0.82 ΔΔ  8.83±0.85  1 102±473  36.77±3.70  158.55±19.53 Δ  19.22±0.83  5.67±0.38
        CTX+LEM组  0.02+1.2     7.30±1.73 ΔΔ  8.58±0.80  1 337±299  48.50±15.08 Δ  171.00±39.89 ΔΔ  20.16±1.47  5.59±1.35
        CTX+LEH组  0.02+2.4     6.82±0.83 ΔΔ  8.11±0.86  1 231±394  37.41±5.18  184.32±58.83 ΔΔ  19.30±3.40  5.06±0.38
                                                 #
                                                                         Δ
                                                                                ΔΔ
                                                        ##
           注:与正常组比较,P<0.05, P<0.01;与模型组比较,P<0.05,P<0.01;与CTX组比较,P<0.05,P<0.01
                               **
                        *
           Note:vs. normal group,P<0.05, P<0.01;vs. model group,P<0.05,P<0.01;vs. CTX group,P<0.05,P<0.01
                           *
                                                           ##
                                  **
                                                     #
                                                                                   ΔΔ
                                                                            Δ
        TNF-α、IL-6 水平均显著降低(P<0.05 或 P<0.01);与              和各给药组Bax蛋白的表达水平均显著升高,各给药组
        CTX 组比较,CTX+LEM 组、CTX+LEH 组的 VEGF、                 Bcl-2 蛋 白 的 表 达 水 平 均 显 著 降 低(P<0.05 或 P<
        TNF-α水平以及各联用组的 IL-6 水平均显著降低(P<                     0.01);与 CTX 组比较,CTX+LEM 组 p53、Bax 蛋白的表
        0.05或P<0.01),详见表4。                                 达水平均显著升高,Bcl-2 蛋白的表达水平均显著降低
        表 3 LE 与 CTX 联用对 H22 荷瘤小鼠肿瘤组织中                     (P<0.01),详见图1、表5。
             MDA 含量和 SOD、GSH 活性的影响(x±±s,n=
             10)
        Tab 3  Effects of LE combined with CTX on MDA       p53
               content,SOD and GSH activities in the tumor
               tissue of H22 tumor-bearing mice(x ±± s,n=
               10)
        组别       剂量,g/kg  MDA,nmol/mL  SOD,U/mL  GSH,U/mL   Bcl-2
        模型组               13.85±4.13  89.11±16.88  389.10±134.05
        CTX组      0.02    11.10±2.16  104.55±17.91 #  459.24±137.37 #
        CTX+LEL组  0.02+0.6  9.34±1.86 #  121.43±21.28 ##  481.24±122.41 ##
        CTX+LEM组  0.02+1.2  8.51±1.93 #  113.62±21.74 #  496.37±125.54 ##Δ
        CTX+LEH组  0.02+2.4  8.27±1.51 ##Δ  130.28±18.29 ##Δ  483.95±107.38 ##
                                                            Bax
                              ##
                        #
                                                Δ
           注:与模型组比较,P<0.05,P<0.01;与CTX组比较,P<0.05
           Note:vs. model group,P<0.05,P<0.01;vs. CTX group,P<
                                                    Δ
                                  ##
                           #
        0.05                                                      模型组             CTX组          CTX+LEM组
        表 4  LE 与 CTX 联用对 H22 荷瘤小鼠肿瘤组织中                    图1    LE与CTX联用对H22荷瘤小鼠肿瘤组织中p53、
             VEGF、TNF-α、IL-6 水平的影响(x±±s,n=10,                    Bcl-2、Bax表达影响的显微图(×400)
             ng/mL)                                        Fig 1  Micrographs of the effects of LE combined with
        Tab 4 Effects of LE combined with CTX on VEGF,            CTX on the expression of p53,Bcl-2 and Bax
               TNF-α and IL-6 levels in the tumor tissue of       in the tumor tissue of H22 tumor-bearing mice
               H22 tumor-bearing mice(x±±s,n=10,ng/mL)           (×400)
        组别       剂量,g/kg    VEGF      TNF-α      IL-6      表5 LE与CTX联用对H22荷瘤小鼠肿瘤组织中p53、
        模型组               116.55±18.92  246.87±64.32  213.31±42.58
        CTX组      0.02     72.98±19.27 ##  159.27±16.82 ##  164.28±21.43 ##  Bcl-2、Bax表达的影响(x±±s,n=10)
        CTX+LEL组  0.02+0.6  56.37±13.58 ##  132.61±28.57 ##  127.09±18.73 ##ΔΔ  Tab 5 Effects of LE combined with CTX on the ex-
        CTX+LEM组  0.02+1.2  52.96±11.26 ##Δ  119.57±20.19 ##Δ  134.62±18.98 ##Δ  pression of p53,Bcl-2 and Bax in the tumor
        CTX+LEH组  0.02+2.4  51.43±14.09 ##Δ  106.82±17.22 ##ΔΔ  112.46±16.51 #ΔΔ
                                                                  tissue of H22 tumor-bearing mice(x±±s,n=10)
                                                 Δ
                               ##
                        #
           注:与模型组比较,P<0.05,P<0.01;与CTX组比较,P<0.05,
        ΔΔ P<0.01                                          组别        剂量,g/kg    p53       Bax       Bcl-2
                                                           模型组                0.278±0.018  0.127±0.008  0.280±0.035
           Note:vs. model group,P<0.05,P<0.01;vs. CTX group,P<
                           #
                                  ##
                                                    Δ
                                                           CTX组      0.02     0.272±0.007  0.227±0.059 ##  0.221±0.043 #
           ΔΔ
        0.05,P<0.01
                                                           CTX+LEM组  0.02+1.2  0.419±0.033 ##ΔΔ  0.482±0.158 ##ΔΔ  0.153±0.026 ##ΔΔ
        3.5  LE 与 CTX 联用对 H22 荷瘤小鼠肿瘤组织中 p53、
                                                                                                    ΔΔ
                                                                                  ##
                                                               注:与模型组比较,P<0.05,P<0.01;与CTX组比较,P<0.01
                                                                           #
        Bax、Bcl-2蛋白表达的影响                                       Note:vs. model group,P<0.05,P<0.01;vs. CTX group, P<
                                                                                     ##
                                                                                                       Δ Δ
                                                                              #
            与模型组比较,CTX+LEM 组小鼠肿瘤组织中 p53                    0.01
        中国药房    2021年第32卷第1期                                                China Pharmacy 2021 Vol. 32 No. 1  ·21 ·