
Page 121 - 202010
P. 121
P=0.08]。 图7。Meta分析结果显示,试验组患者主要出血事件发
生率显著高于对照组[OR=1.54,95%CI(1.19,1.99),
P=0.001]。
Wang H 2016
Park KH 2016
Goto S 2015
Kang HJ 2015
Chen IC 2016
Random sequence generation(selection bias)
Allocation concealment(selection bias)
Blinding of participants and personnel(penormance bias)
Blinding of outcome assessment(detection bias)
Incomplete outcome data(attrition bias)
图6 两组患者脑卒中发生率的Meta分析森林图
Selective reporting(reporting bias)
Fig 6 Forest plot of Meta-analysis of the incidence of
Other bias
stroke in 2 groups
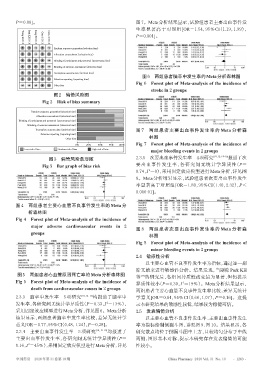
图2 偏倚风险图
Fig 2 Risk of bias summary
Random sequence generation(selection bias)
Allocation concealment(selection bias)
Blinding of participants and personnel(penormance bias)
Blinding of outcome assessment(detection bias)
Incomplete outcome data(attrition bias) 图 7 两组患者主要出血事件发生率的 Meta 分析森
Selective reporting(reporting bias)
Other bias 林图
0% 25% 50% 75% 100% Fig 7 Forest plot of Meta-analysis of the incidence of
major bleeding events in 2 groups
Low risk of bias Unclear risk of bias High risk of bias
图3 偏倚风险条形图 2.3.5 次要出血事件发生率 4项研究 [10,12,14-15] 报道了次
Fig 3 Bar graph of bias risk 要出血事件发生率,各研究间无统计学异质性(P=
0.74,I =0),采用固定效应模型进行 Meta 分析,详见图
2
8。Meta 分析结果显示,试验组患者次要出血事件发生
率显著高于对照组[OR=1.80,95%CI(1.40,2.32),P<
0.000 01]。
图 4 两组患者主要心血管不良事件发生率的 Meta 分
析森林图
Fig 4 Forest plot of Meta-analysis of the incidence of
major adverse cardiovascular events in 2
图 8 两组患者次要出血事件发生率的 Meta 分析森
groups
林图
Fig 8 Forest plot of Meta-analysis of the incidence of
minor bleeding events in 2 groups
2.4 敏感性分析
以主要心血管不良事件发生率为指标,通过逐一剔
除文献来进行敏感性分析。结果发现,当剔除 Park KH
图5 两组患者心血管原因死亡率的Meta分析森林图
[14]
等 的研究后,各组间异质性改变最为显著,但仍提示
Fig 5 Forest plot of Meta-analysis of the incidence of
2
异质性较小(P=0.30,I =19%)。Meta 分析结果显示,
death from cardiovascular causes in 2 groups
两组患者主要心血管不良事件发生率比较,差异无统计
2.3.3 脑卒中发生率 5 项研究 [10,12-15] 均报道了脑卒中 学意义[OR=0.84,95%CI(0.66,1.07),P=0.16]。这提
发生率,各研究间无统计学异质性(P=0.33,I =13%), 示本研究结果的敏感性较低,结果较为稳健可信。
2
采用固定效应模型进行Meta分析,详见图6。Meta分析 2.5 发表偏倚分析
结果显示,两组患者脑卒中发生率比较,差异无统计学 以主要心血管不良事件发生率、主要出血事件发生
意义[OR=0.77,95%CI(0.48,1.24),P=0.28]。 率为指标绘制倒漏斗图,详见图 9、图 10。结果显示,各
2.3.4 主要出血事件发生率 5 项研究 [10,12-15] 均报道了 研究散点均位于倒漏斗图中上方,且较均匀分布于中线
主要出血事件发生率,各研究间无统计学异质性(P= 两侧,图形基本对称,提示本研究存在发表偏倚的可能
0.16,I =45%),采用固定效应模型进行Meta分析,详见 性较小。
2
中国药房 2020年第31卷第10期 China Pharmacy 2020 Vol. 31 No. 10 ·1263 ·