Page 52 - 《中国药房》2020年第24期
P. 52

定为50 μg/mL,辐射后继续干预时间确定为2 d。
        表2    不同质量浓度黄芪皂苷继续干预不同时间对BM-
              SCs增殖的影响结果(x±±s,n=3)
        Tab 2 Effects of different concentrations of astraga-
               lus saponin on the proliferation of BMSCs for
               different time(x±±s,n=3)
        继续干预                            OD值                           A.空白组                 B.辐射组
        时间,d   空白组    辐射组   25 μg/mL  50 μg/mL  75 μg/mL  100 μg/mL
        1    0.285±0.019 0.152±0.026 0.368±0.048 0.248±0.039  0.187±0.075 0.210±0.024 *
                          *
                                 ##
                                 #
                                                #
                          *
        2    0.483±0.070 0.345±0.037 0.506±0.016 0.538±0.037 ##  0.487±0.022 0.456±0.021
                                                *
                          **
        3    0.795±0.038 0.613±0.039 0.837±0.085 0.827±0.111 ##  0.759±0.049 0.485±0.032 **
                                 ##
        4    0.981±0.048 0.814±0.028 0.865±0.092 0.912±0.042 ##  0.883±0.101 0.610±0.061 **
                          *
                                                *
        5    1.226±0.064 1.023±0.042 1.040±0.032 1.112±0.027  1.111±0.083 0.891±0.097 **
                          *
                                 *
                                                *
            注:与空白组比较, P<0.05, P<0.01;与辐射组比较,P<
                                 * *
                                                     #
                          *
        0.05,P<0.01                                                  C.黄芪多糖组              D.黄芪皂苷组
            ##
            Note:vs. blank group, P<0.05, P<0.01;vs. radiation group,
                           *
                                  * *
        #      ##
         P<0.05,P<0.01
        表3    不同质量浓度黄芪黄酮继续干预不同时间对BM-
              SCs增殖的影响结果(x±±s,n=3)
        Tab 3 Effects of different concentrations of astraga-
               lus flavonoids on the proliferation of BMSCs
               for different time(x±±s,n=3)                                    E.黄芪黄酮组
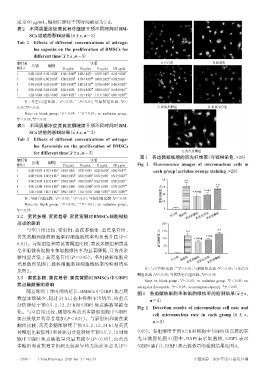
                                                             图1   各组微核细胞的荧光纤维图(吖啶橙染色,×20)
        继续干预                            OD值
        时间,d   空白组    辐射组   25 μg/mL  50 μg/mL  75 μg/mL  100 μg/mL  Fig 1  Fluorescence images of micronucleus cells in
        1    0.285±0.019 0.152±0.026 0.236±0.025 0.278±0.019 0.203±0.018 0.206±0.017 *  each group(acridine orange staining,×20)
                          *
                                               *
                          *
                                 #
        2    0.483±0.070 0.345±0.037 0.466±0.052 0.501±0.047 0.412±0.039 0.312±0.022 **
                                        #
                          **
                                        #
        3    0.795±0.038 0.613±0.039 0.769±0.067 0.801±0.076 0.625±0.078 0.386±0.023 **  80  **
                                 #
        4    0.981±0.048 0.814±0.028 0.845±0.088 0.968±0.088 0.733±0.059 0.578±0.077 **  ‰  60  **
                          *
                                        #
                                               **
                          *
                                 *
        5    1.226±0.064 1.023±0.042 0.966±0.057 1.162±0.103 0.848±0.093 0.675±0.089 **  微核细胞率,  40  **#Δ▲  **#Δ
            注:与空白组比较,P<0.05, P<0.01;与辐射组比较,P<0.05                      20
                                                  #
                        *
                               **
                           *
            Note:vs. blank group, P<0.05, P<0.01;vs. radiation group,
                                  * *
        # P<0.05                                                       0
        3.2  黄芪多糖、黄芪皂苷、黄芪黄酮对BMSCs细胞微核                                     空白组  辐射组 黄芪多糖组 黄芪皂苷组 黄芪黄酮组
        形成的影响                                                          200
            与空白组比较,辐射组、黄芪多糖组、黄芪皂苷组、                                   ‰  150     **           **
        黄芪黄酮组微核细胞率和细胞微核率均显著升高(P<                                      细胞微核率,  100   **#Δ▲  **#Δ
        0.01)。与辐射组和黄芪黄酮组比较,黄芪多糖组和黄芪                                    50
        皂苷组微核细胞率和细胞微核率均显著降低,且黄芪多
                                                                        0
        糖组显著低于黄芪皂苷组(P<0.05)。各组微核细胞荧                                       空白组  辐射组 黄芪多糖组 黄芪皂苷组 黄芪黄酮组
        光显微图见图 1,微核细胞率和细胞微核率的检测结果
                                                               注:与空白组比较, P<0.01;与辐射组比较,P<0.05;与黄芪黄
                                                                                               #
                                                                            **
        见图2。
                                                            酮组比较,P<0.05;与黄芪皂苷组比较,P<0.05
                                                                   Δ
                                                                                       ▲
        3.3  黄芪多糖、黄芪皂苷、黄芪黄酮对BMSCs中53BP1
                                                                              *
                                                               Note:vs. blank group,P<0.05;vs. radiation group,P<0.05;vs.
                                                                                                   #
        焦点簇数量的影响
                                                                           Δ
                                                                                                 ▲
                                                            astragalus flavonoids,P<0.05;vs.astragalus saponin, P<0.05
            随着继续干预时间的延长,BMSCs中53BP1焦点簇                      图2   各组微核细胞率和细胞微核率的检测结果(x±±s,
        数量逐渐减少,超过 24 h 已基本检测不出结果,故重点
                                                                 n=3)
        分析继续干预 0.5、2、12、24 h 时 53BP1 焦点簇数量的变
                                                            Fig 2 Detection results of micronucleus cell rate and
        化。与空白组比较,辐射组和黄芪多糖组细胞中53BP1
                                                                  cell micronucleus rate in each group(x ±± s,
        焦点簇数量均显著增加(P<0.01)。与辐射组和黄芪黄
                                                                  n=3)
        酮组比较,黄芪多糖组继续干预 0.5、2、12、24 h(与黄芪
        黄酮组比较除外)和黄芪皂苷组继续干预0.5、2、12时细                        0.05)。各组继续干预0.5 h时细胞中53BP1焦点簇的荧
        胞中 53BP1 焦点簇数量均显著减少(P<0.05),而黄芪                     光显微图见图 3(图中,DAPI 表示细胞核,53BP1 表示
        多糖组和黄芪皂苷组间比较差异均无统计学意义(P>                            53BP1蛋白),53BP1焦点簇数量的检测结果见图4。
        ·2990 ·  China Pharmacy 2020 Vol. 31 No. 24                                 中国药房    2020年第31卷第24期
   47   48   49   50   51   52   53   54   55   56   57