
Page 53 - 《中国药房》2021年24期
P. 53
A.接近中心性方法 B.度中心性方法 C.最大邻居组件方法
注:从红色到黄色,其密切程度逐渐减小
Note:from red to yellow,the close degree decreases
图6 交叉靶点PPI网络的CytoHubba分析图
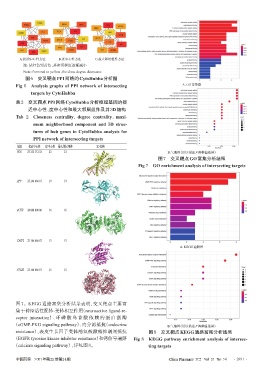
Fig 6 Analysis graphs of PPI network of intersecting A. GO富集图
targets by CytoHubba
表2 交叉靶点PPI网络CytoHubba分析枢纽基因的接
近中心性、度中心性和最大邻居组件及其3D结构
Tab 2 Closeness centrality,degree centrality,maxi-
mum neighborhood component and 3D struc-
tures of hub genes in CytoHubba analysis for
PPI network of intersecting targets
基因 接近中心性 度中心性 最大邻居组件 3D结构
FOS 27.333 333 33 23 23 B.气泡图(用以描述P调整值范围)
图7 交叉靶点GO富集分析结果
Fig 7 GO enrichment analysis of intersecting targets
APP 25.166 666 67 19 19
ACHE 24.000 000 00 16 16
CASP3 23.166 666 67 15 15
A. KEGG通路图
PTGS2 23.166 666 67 15 15
图 7。KEGG 通路富集分析结果表明,交叉靶点主要富
集于神经活性配体-受体相互作用(neuroactive ligand-re-
ceptor interaction)、环 磷 酸 鸟 苷 酸 依 赖 的 蛋 白 激 酶
(cGMP-PKG signaling pathway)、内分泌抵抗(endocrine B.气泡图(用以描述P调整值范围)
resistance)、表皮生长因子受体酪氨酸激酶抑制剂抵抗 图8 交叉靶点KEGG通路富集分析结果
(EGFR tyrosine kinase inhibitor resistance)和钙信号通路 Fig 8 KEGG pathway enrichment analysis of intersec-
(calcium signaling pathway),详见图8。 ting targets
中国药房 2021年第32卷第24期 China Pharmacy 2021 Vol. 32 No. 24 ·2991 ·