
Page 28 - 2021年15期
P. 28
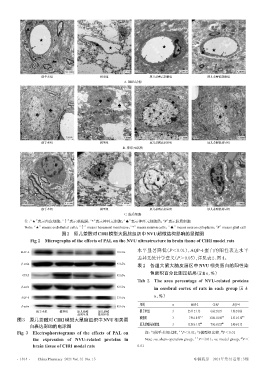
假手术组                     模型组                  原儿茶醛高剂量组                 原儿茶醛低剂量组
                                                      A. BBB结构


                   假手术组                     模型组                  原儿茶醛高剂量组                 原儿茶醛低剂量组
                                                      B. 神经元结构


                   假手术组                     模型组                  原儿茶醛高剂量组                 原儿茶醛低剂量组
                                                      C. 胶质细胞
            注:“★”表示内皮细胞;“↑”表示基底膜;“*”表示神经元细胞;“♠”表示神经元细胞质;“#”表示胶质细胞
            Note:“★”means endothelial cells;“↑”means basement membrane;“*”means neuron cells;“♠”means neuron cytoplasm;“#”means glial cell
                           图2    原儿茶醛对CIRI模型大鼠脑组织中NVU超微结构影响的显微图
              Fig 2 Micrographs of the effects of PAL on the NVU ultrastructure in brain tissue of CIRI model rats
                                                            水平显著降低(P<0.01),AQP-4 蛋白的阳性表达水平
          MAP-2                                    70 kDa
                                                            差异无统计学意义(P>0.05),详见表2、图4。
          β-actin                                  42 kDa
                                                            表 2  各组大鼠大脑皮层区中 NVU 相关蛋白的阳性染
                                                                 色面积百分比测定结果(x±±s,%%)
           GFAP                                    52 kDa
                                                            Tab 2 The area percentage of NVU-related proteins
          β-actin                                  42 kDa          in cerebral cortex of rats in each group(x ±±
                                                                   s,%%)
          AQP-4                                    33 kDa
                                                             组别            n       MAP-2    GFAP     AQP-4
          β-actin                                  42 kDa
                 假手术组      模型组    原儿茶醛     原儿茶醛              假手术组          3      25.11±1.12  6.66±0.73  1.96±0.06
                                  高剂量组     低剂量组
        图3    原儿茶醛对CIRI模型大鼠脑组织中NVU相关蛋                        模型组           3      7.96±0.93 **  15.86±0.44 **  2.53±0.10 **
              白表达影响的电泳图                                      原儿茶醛高剂量组      3      12.58±1.12 ##  7.96±0.52 ##  2.40±0.12
                                                                              **
        Fig 3  Electrophoretograms of the effects of PAL on    注:与假手术组比较, P<0.01;与模型组比较,P<0.01
                                                                                                ##
                                                                                    **
               the expression of NVU-related proteins in       Note:vs. sham operation group, P<0.01;vs. model group,P<
                                                                                                        ##
               brain tissue of CIRI model rats              0.01
        ·1814 ·  China Pharmacy 2021 Vol. 32 No. 15                                 中国药房    2021年第32卷第15期